

County math trumps polling every time, and the math ain’t mathin’
In the early stages of the 2024 election cycle, I created a series of pessimistic forecasts for the seven decisive states. I made them to simulate a repeat of the 2020 election, complete with its suburban swings, urban booms (yes, almost everyone knows exactly where that came from), and with the Democrat nominee somehow running ludicrously high ballot counts in rural or “Trump central” mid-sized counties.
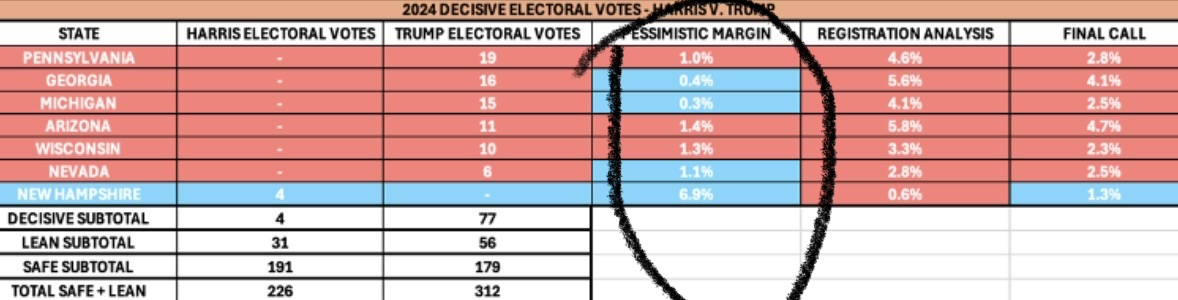
I contrasted those concessions with a registration analysis, which turned out to be too bullish in every state but Nevada (and almost right on the money in Arizona), and when blending the two disciplines – produced seven perfect calls, with none of my margins missing by more than two points. Yes, I was more accurate than the most accurate pollsters while completely crapping all over polling. For some reason, the New York Times is no longer interested in interviewing me.

That was then, this is now. Texas is at risk, they’re telling me in the polls. What can we discern about the Lone Star State using a pessimistic model? Lots has changed since Beto O’Rourke gave Ted Cruz all he wanted in the 2018 Senate race in the middle of a suburban reorganization and lingering Trump-Cruz factional drama. Namely, this:
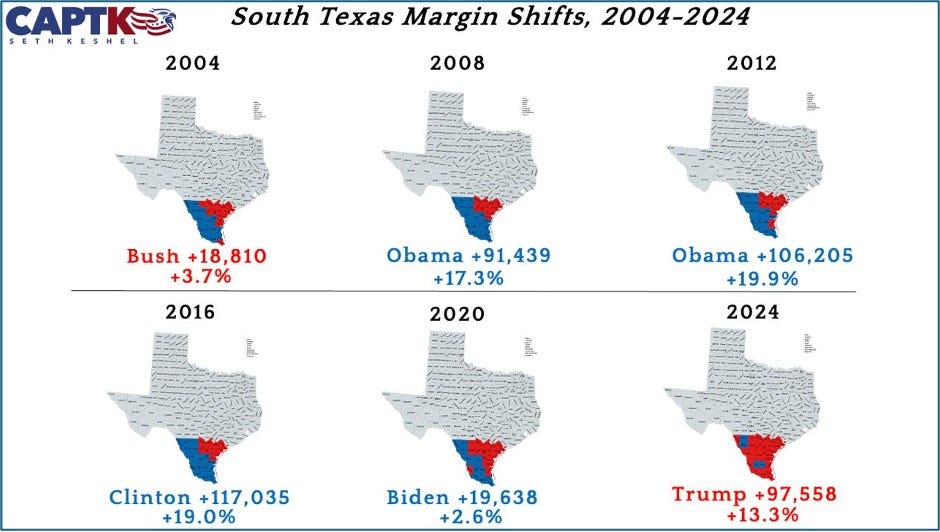
Not just in South Texas, but all over. From the Trans-Pecos region, to the Llano Estacado, to the cities with working-class Hispanics, and everywhere in between. Ken Paxton isn’t defending a Trump +9.0% state full of Bushies who held their nose in 2016. He’s defending a Trump +13.7% that, if we let it stick, crushes the Democrats’ dreams for the future Texas:
How Trump Saved Texas, In One Stunning Image
I could go on and on, but the purpose of this post is to show you my pessimistic math that demonstrates exactly why I think Paxton should win against James Talarico, and additionally, why Talarico is demanding to debate the Texas Attorney General despite polling looking like something out of a dystopian novel.
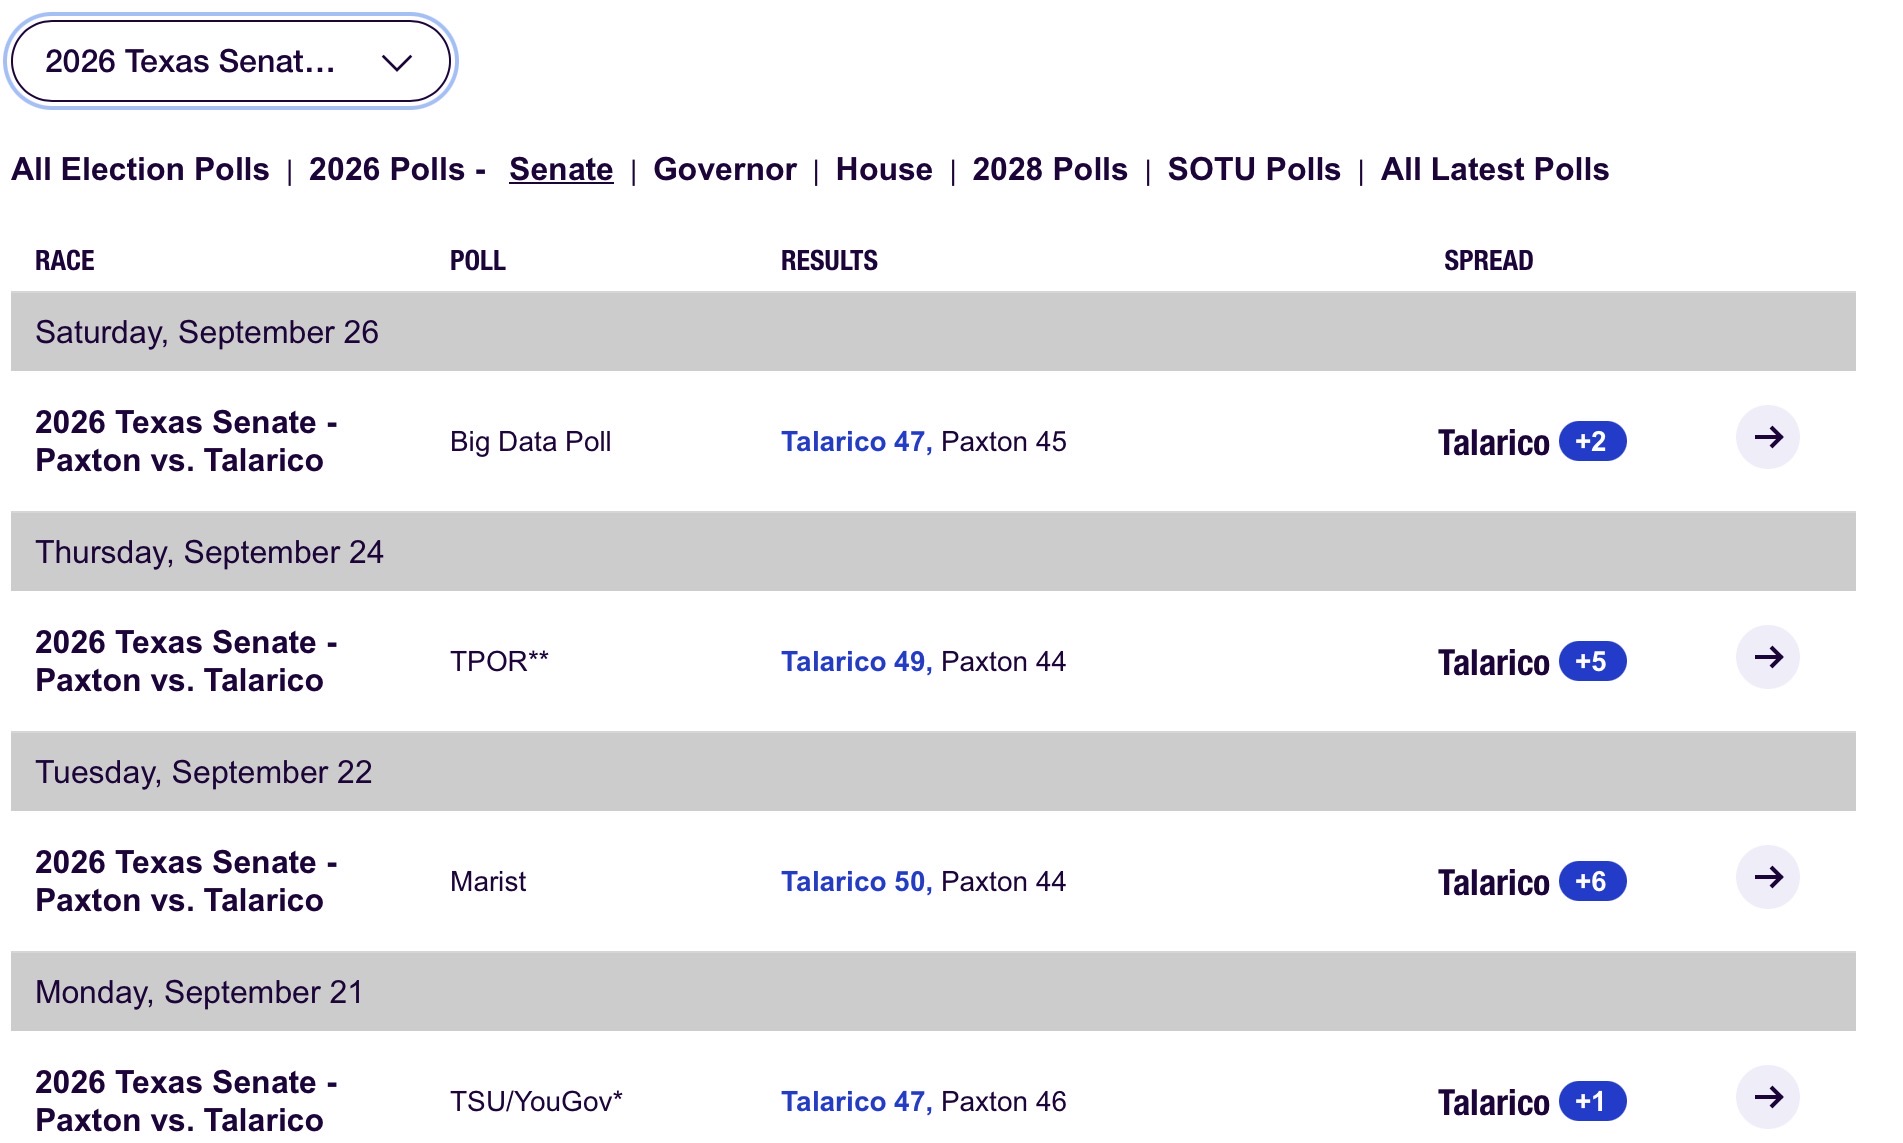
In the past 10 days, Talarico’s polling average is +3.5%. There is a vast field of difference between a +6 poll (roughly 600,000 margin this year, which is impossible for a Democrat), and a +1-2 poll complete with standard polling problems like response bias, Cornyn-Paxton factional feuding, and straight up incompetence.
But what do the data say?
We need to go back to the 2016-18 timeframe to understand modern Texas. Trump got smoked in the overwhelmingly Hispanic counties of South Texas his first time around, and wore big losing margins in the major metros. No one had seen a Democrat presidential margin in Harris County as large as Clinton’s +12.3% since the old “Solid South” days (1964 and LBJ, to be exact). Still, despite Ted Cruz losing 6.4% of Trump’s 2016 margin in holding off O’Rourke, these counties shifted Republican from the 2016 presidential election to the 2018 Senate election in favor of Cruz:
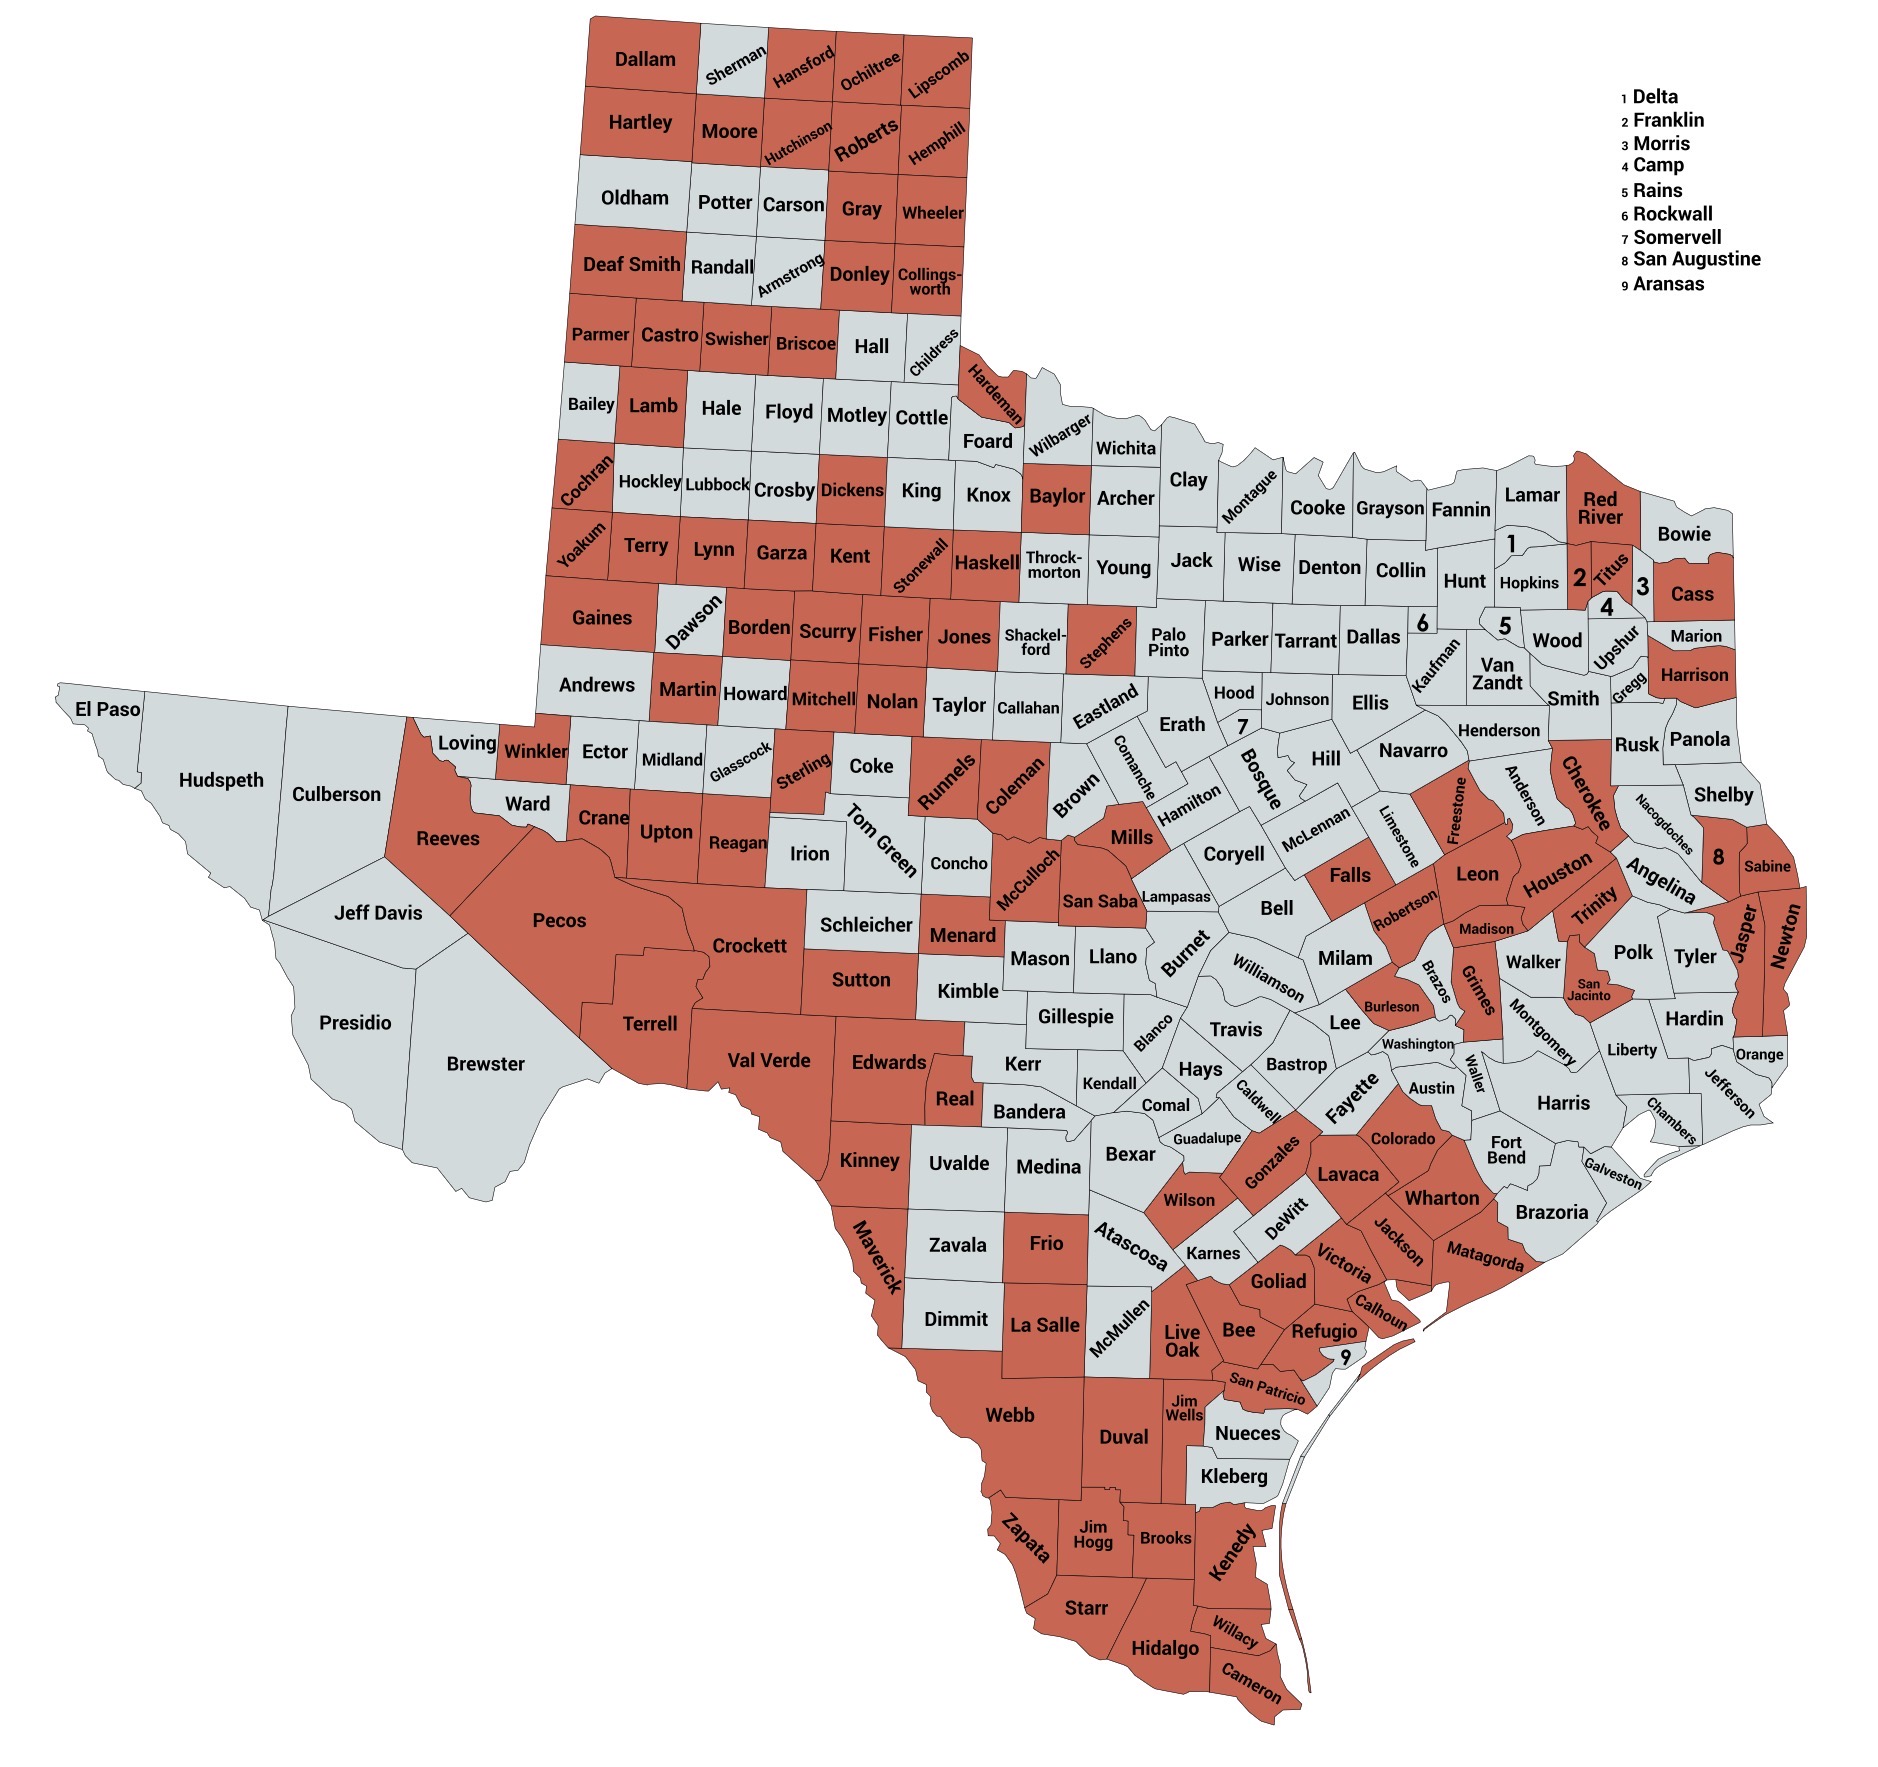
107 in all, and overwhelmingly Hispanic. 52 counties shifting toward O’Rourke did so by less than 2 points, with many doing so thanks to turnout differentials in midterms or just plain old statistical noise in small counties. O’Rourke’s narrow loss, the closest race in Texas since 1998, was propelled by these shifts:
- Hays County, Trump +0.8% to O’Rourke +15.4%, moving 12,872 margin
- Williamson County, Trump +9.6% to O’Rourke +2.9%, moving 25,705 margin
- Denton County, Trump +20.0% to Cruz +8.2%, moving 35,621 margin
- Travis County, Clinton +38.6% to O’Rourke +49.7%, moving 59,438 margin
- Collin County, Trump +16.6% to Cruz +6.1%, moving 38,601 margin
- Tarrant County, Trump +8.6% to O’Rourke +0.7%, moving 61,825 margin
- Dallas County, Clinton +25.9% to O’Rourke +33.0%, moving 42,118 margin
- Bexar County, Clinton +13.3% to O’Rourke +19.9%, moving 30,167 margin
- Fort Bend County, Clinton +6.6% to O’Rourke +12.1%, moving 13,610 margin
And finally…
- El Paso County, Clinton +42.8% to O’Rourke +49.4%, moving 8,216 margin – this is O’Rourke’s home county and, as you will read, a major obstacle to Talarico’s presumptive pathway to victory
The shifts in Texas from 2018 to 2026 define why Paxton should be expected to win his race for the U.S. Senate.
The model I’m describing today has to determine two things – turnout and margin.
For turnout:
I calculate turnout coefficients as percentage of the previous presidential vote. In Travis County (Austin), there were 468,720 total votes for President and 484,204 for “Betomania” in 2018 (the U.S. Senate race). That means Travis produced 103.3% of its 2016 presidential vote total. In these 15 counties, I have set turnout equal to the 2018 share as described above to give Talarico a strength of turnout he may not have:
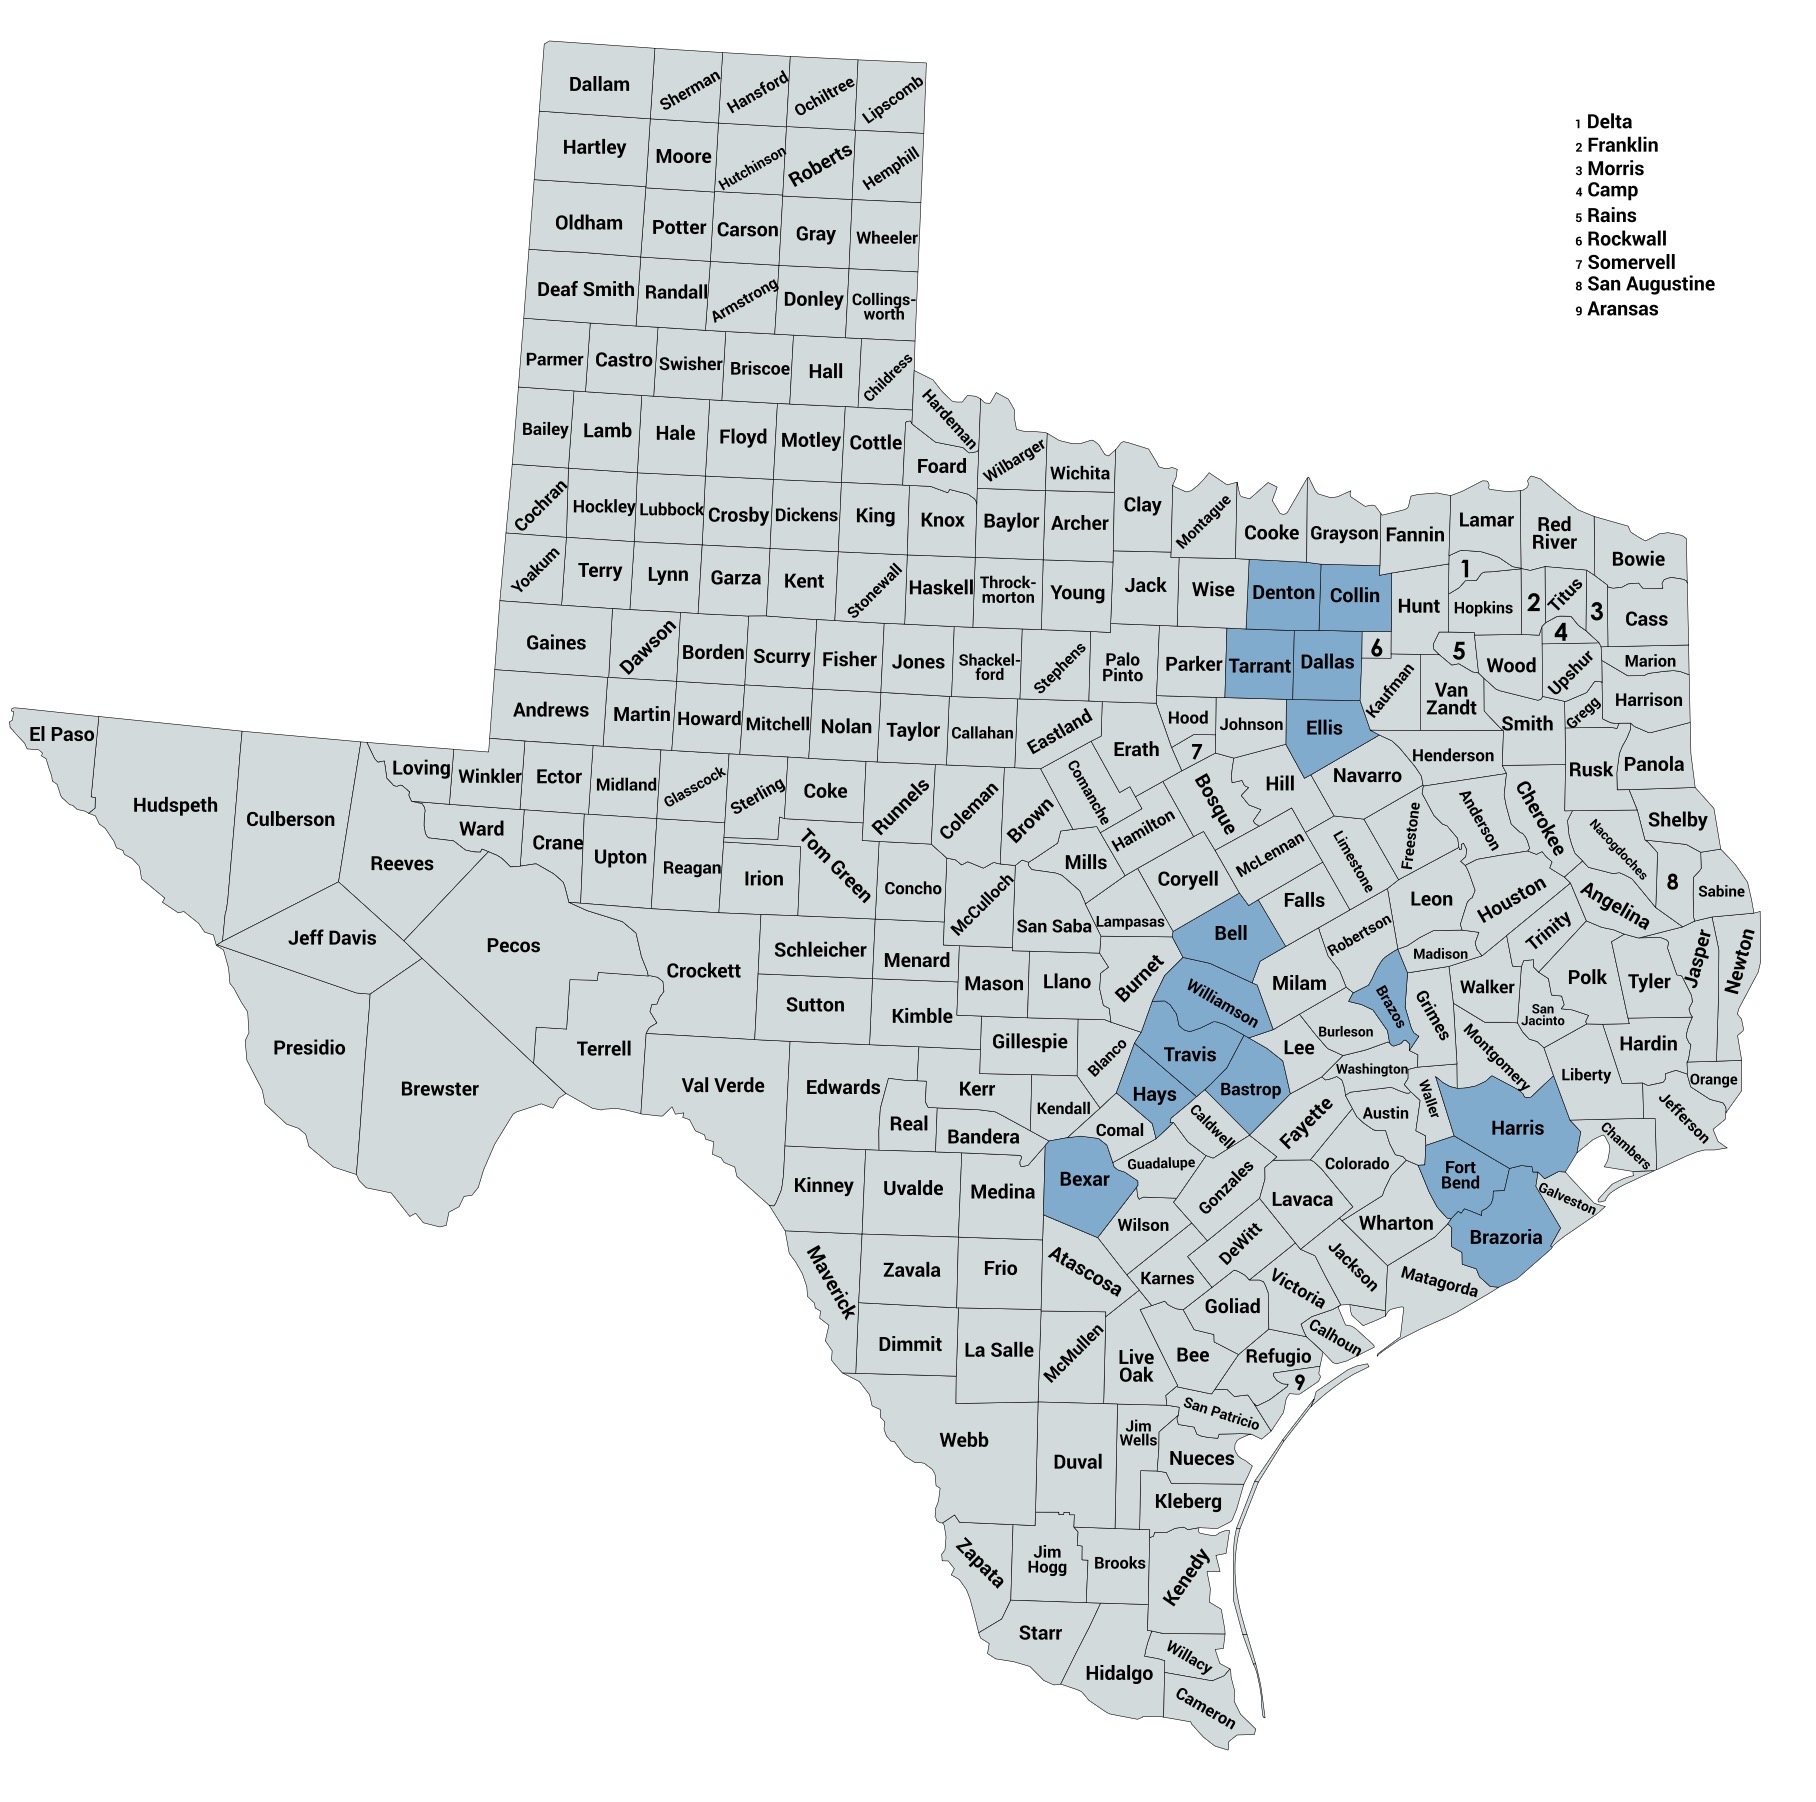
Because of the fear of Texas turning blue, “red Texas” turned out in huge numbers, with many counties exceeding 90% of their 2016 presidential vote count. To ensure I don’t overestimate Paxton’s support, in practically every county not shaded in blue, I have averaged the 2018 and 2022 turnout coefficients. For example, using Lamar County (Trump +60.9% on 21,285 total votes), 88.5% of presidential vote in the 2016/18 cycles and 71.6% in the 2020/22 cycles (with no threat of a Democrat winning Texas in 2022) comes out to turnout estimate for this cycle of 80.0% of the 2024 presidential vote.
For margin:
In the blue-shaded counties mapped above, I have given Talarico margins five points stronger than O’Rourke’s in 2018. For instance, O’Rourke won Travis County by 49.67% in 2018. For 2026, I’m letting Talarico take it by 54.67%. That wouldn’t surprise me, but him getting five point margin gains over O’Rourke in all of the counties above would shock me. For Brazoria County, thanks to a Cruz lag in 2024, I’ve given Talarico a margin ten points stronger than Beto’s.
In most of the Trump-won counties, I’m deducting five points from Trump’s 2024 margins. Where he has won Hardin County by 75.8%, now it’s going to be Paxton +70.8%, with the turnout averaged as described above. This undercuts Paxton’s likely margins while amplifying Talarico’s urban and suburban performance potential. In counties in which Cruz lagged behind Trump by a lot, I’ve spotted Paxton’s margin right at Cruz’s from 2024, instead of adjusting off Trump’s.
In the following “Trump special” counties, the overwhelmingly Latino counties, I’ve set Paxton’s margin at Trump’s 2020 presidential margin, which revealed the heavy trend in South Texas and beyond:
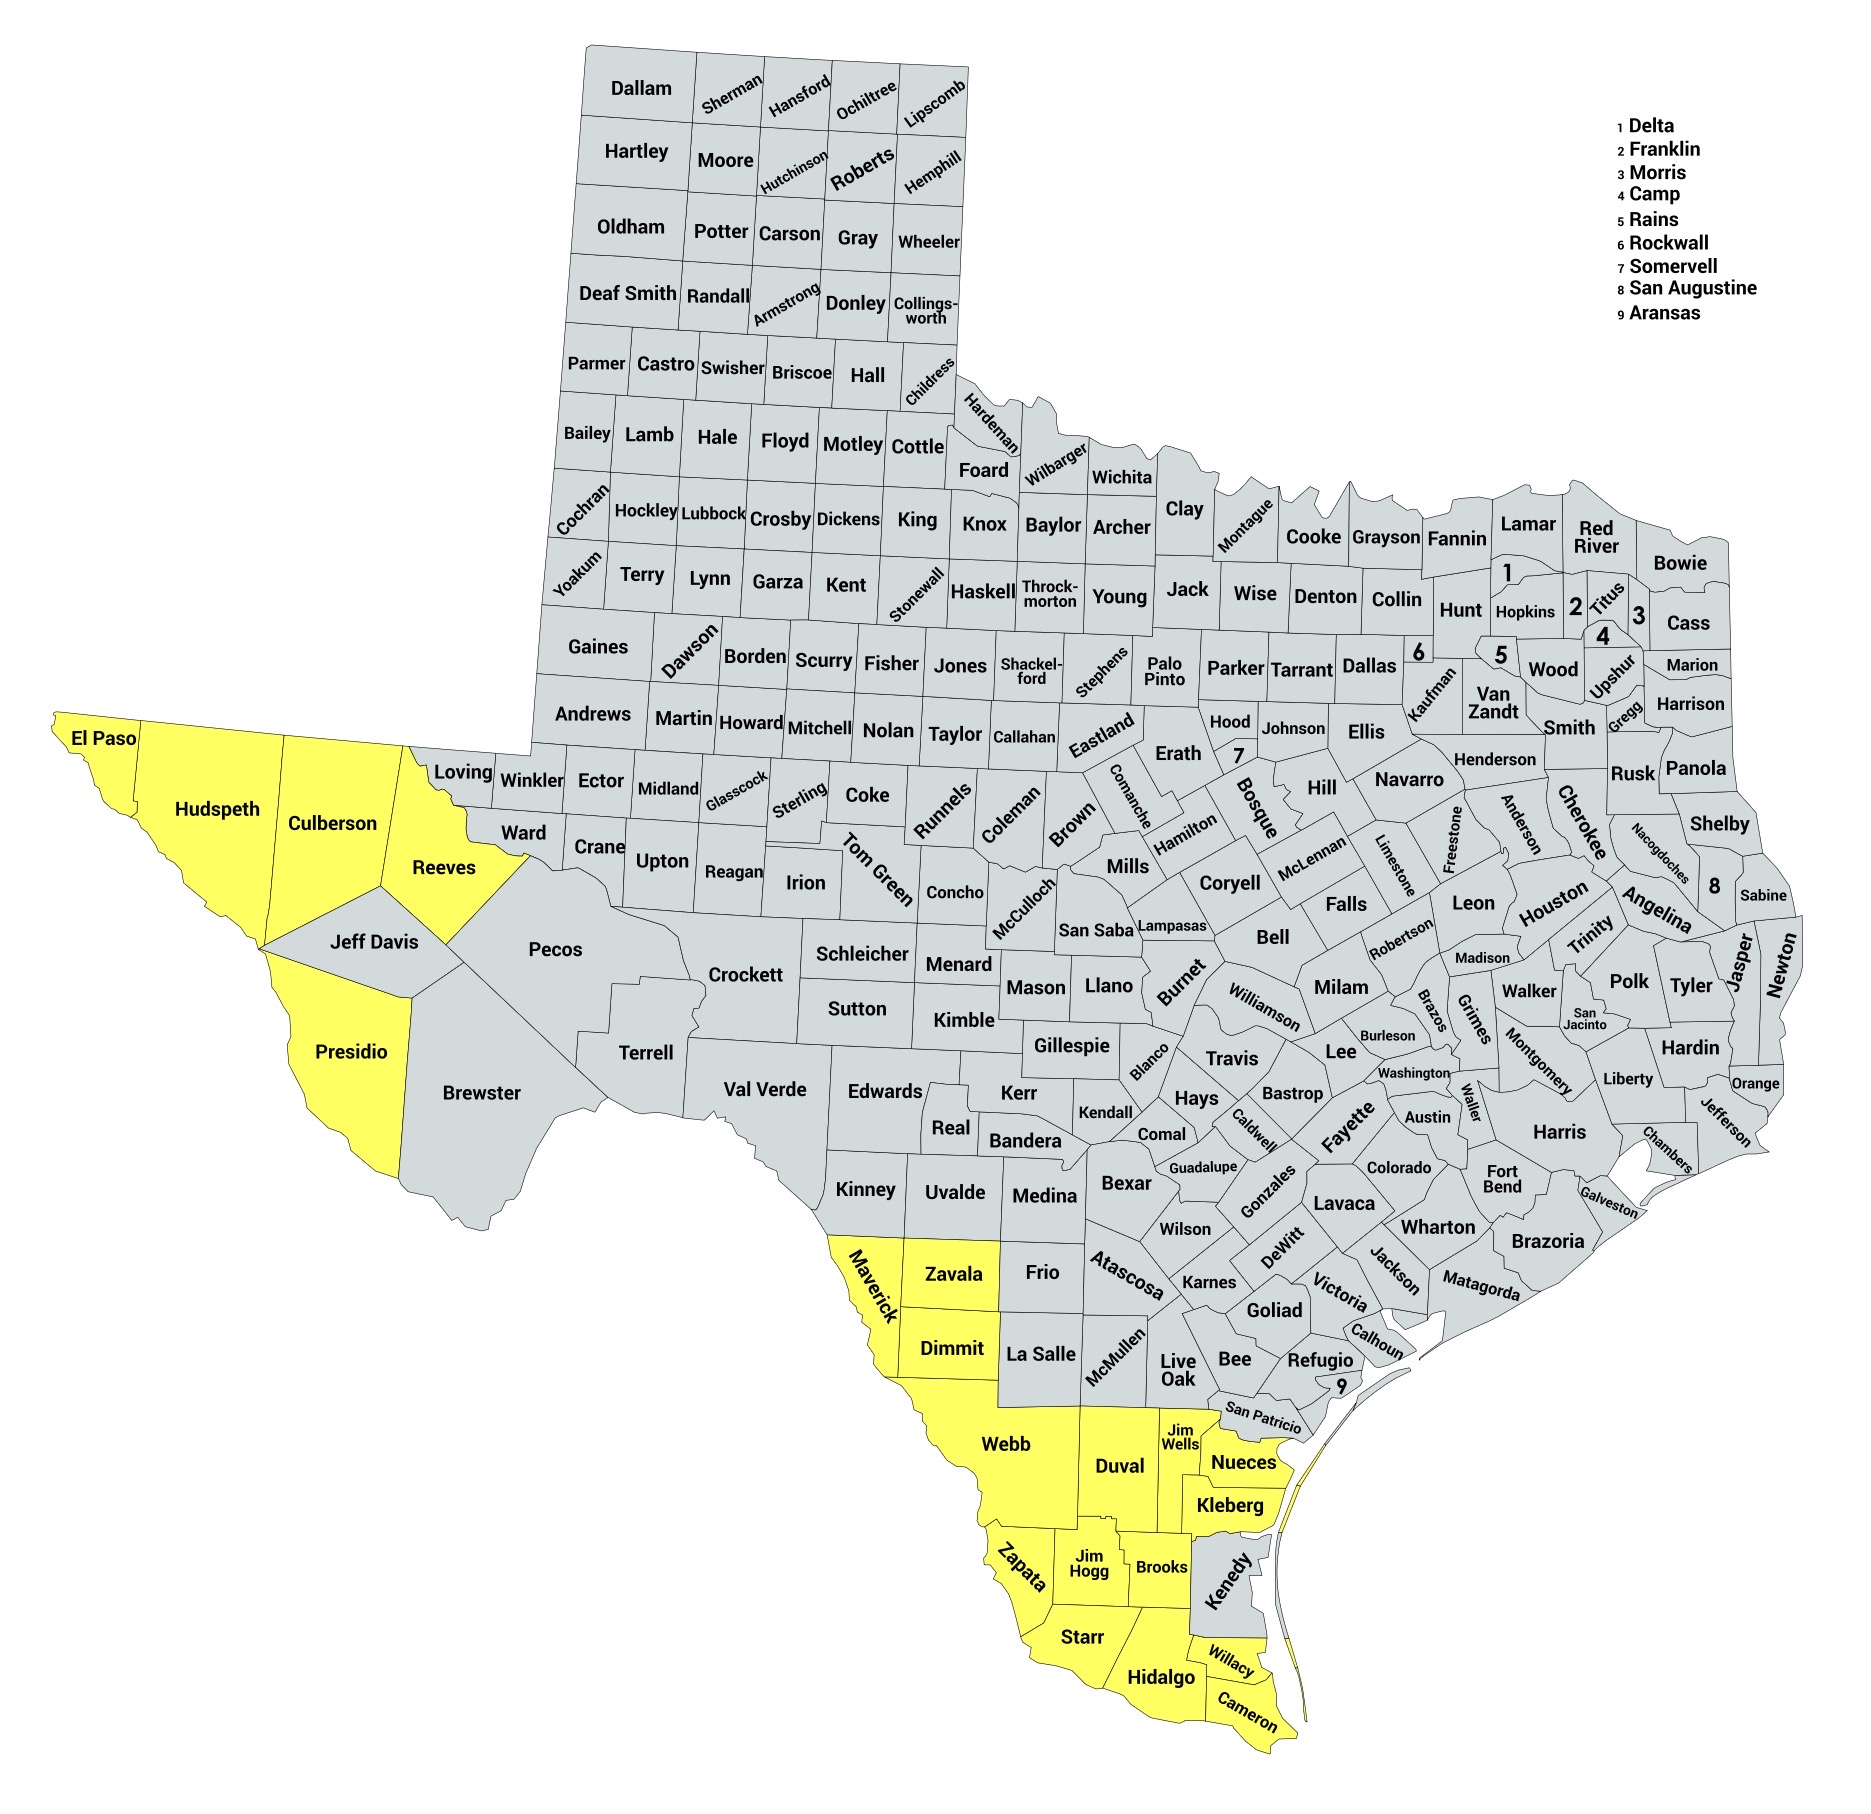
Whereas Trump won Cameron County by 5.8% (and Cruz lost by 4.3%), I’m setting Paxton’s margin there back to the 2020 presidential margin, which was Biden +13.1%. Based on the Latino counties shifting for Cruz in 2018, I’m not confident Paxton will lose Cameron County by 13.1%, if he loses it at all. Latino-specific polling is usually wildly wrong, and in some of the ridiculous Talarico polls out there, Paxton is hovering around 40% Latino support anyway.
One county that is going to absolutely kill Talarico is El Paso. Trump lost it by just 15.1% in 2024, after having dropped it to Biden by 35.1%. I’m giving Talarico the margin of 35.1%, which is extremely high and probably not going to happen. Beto O’Rourke blew out his home county by 49.4% over Cruz, taking the margin to +100,545, when it had been just +92,328 in a presidential election two years earlier. Talarico taking 35.1% margin at an average turnout gives him a margin of +68,969, or 31,576 short of Betomania 2018.
He will have to make those up somewhere else to get over the top. Since 2018, the minor red counties people don’t know how to spot on a map – the Woods, Fannins, Wises, Graysons, Rockwalls, and Chamberses of Texas – have grown in population and maintained their ridiculous margins – often over 65% in decent-sized counties. I have these estimates – already short-shotted for Paxton by my model – for ballots gained over 2018 margin:
- Montgomery – +18,490 net gain over 2018
- Parker – +15,587 net gain over 2018
- Comal – +11,095 net gain over 2018
- Grayson – +6,523 net gain over 2018
This list goes on and on.
Affording Talarico’s turnout model and margin gains, here is what he stands to gain in the big four over Beto’s raw 2018 margins:
- Harris – +109,331 net gain over 2018
- Travis – +87,777 net gain over 2018
- Dallas – +66,815 net gain over 2018
- Bexar – +65,166 net gain over 2018
He also makes huge gains in the other key counties I’ve identified above…and is even allowed to flip Collin County and come close in Denton…
Just so he can lose in this model to Ken Paxton by 14,035 votes.
I did not set out in creating this model to make a virtual tie. That is just how it came out with me affording Talarico five point or better gains across the board in all but the “Trump special” Latino counties specified above, with turnout depressed in red counties and pumping at 2018 rates in counties Talarico will need to win.
Now imagine if the red counties don’t lag in margin by five points across the board, and turnout climbs to match 2018 intensity, or even higher now that everyone is warning of the impending doom of a blue Texas. Imagine if most of Trump’s Latino gains do actually stick like they did in 2018.
If the reds turn out and Latinos don’t abandon Trump, Paxton will win this race in the mid-single digits, or better.
PSYCHOLOGY
Talarico isn’t up by 5 or 6 points, despite the two polls in the last week giving us exactly those numbers. I am forecasting 10.251 million votes in the pessimistic model. Therefore, every percentage point of margin is equal to almost exactly 100,000 votes. In order for a Democrat to win Texas by 5 points, a half-million votes, millions of red voters would have to stay home.
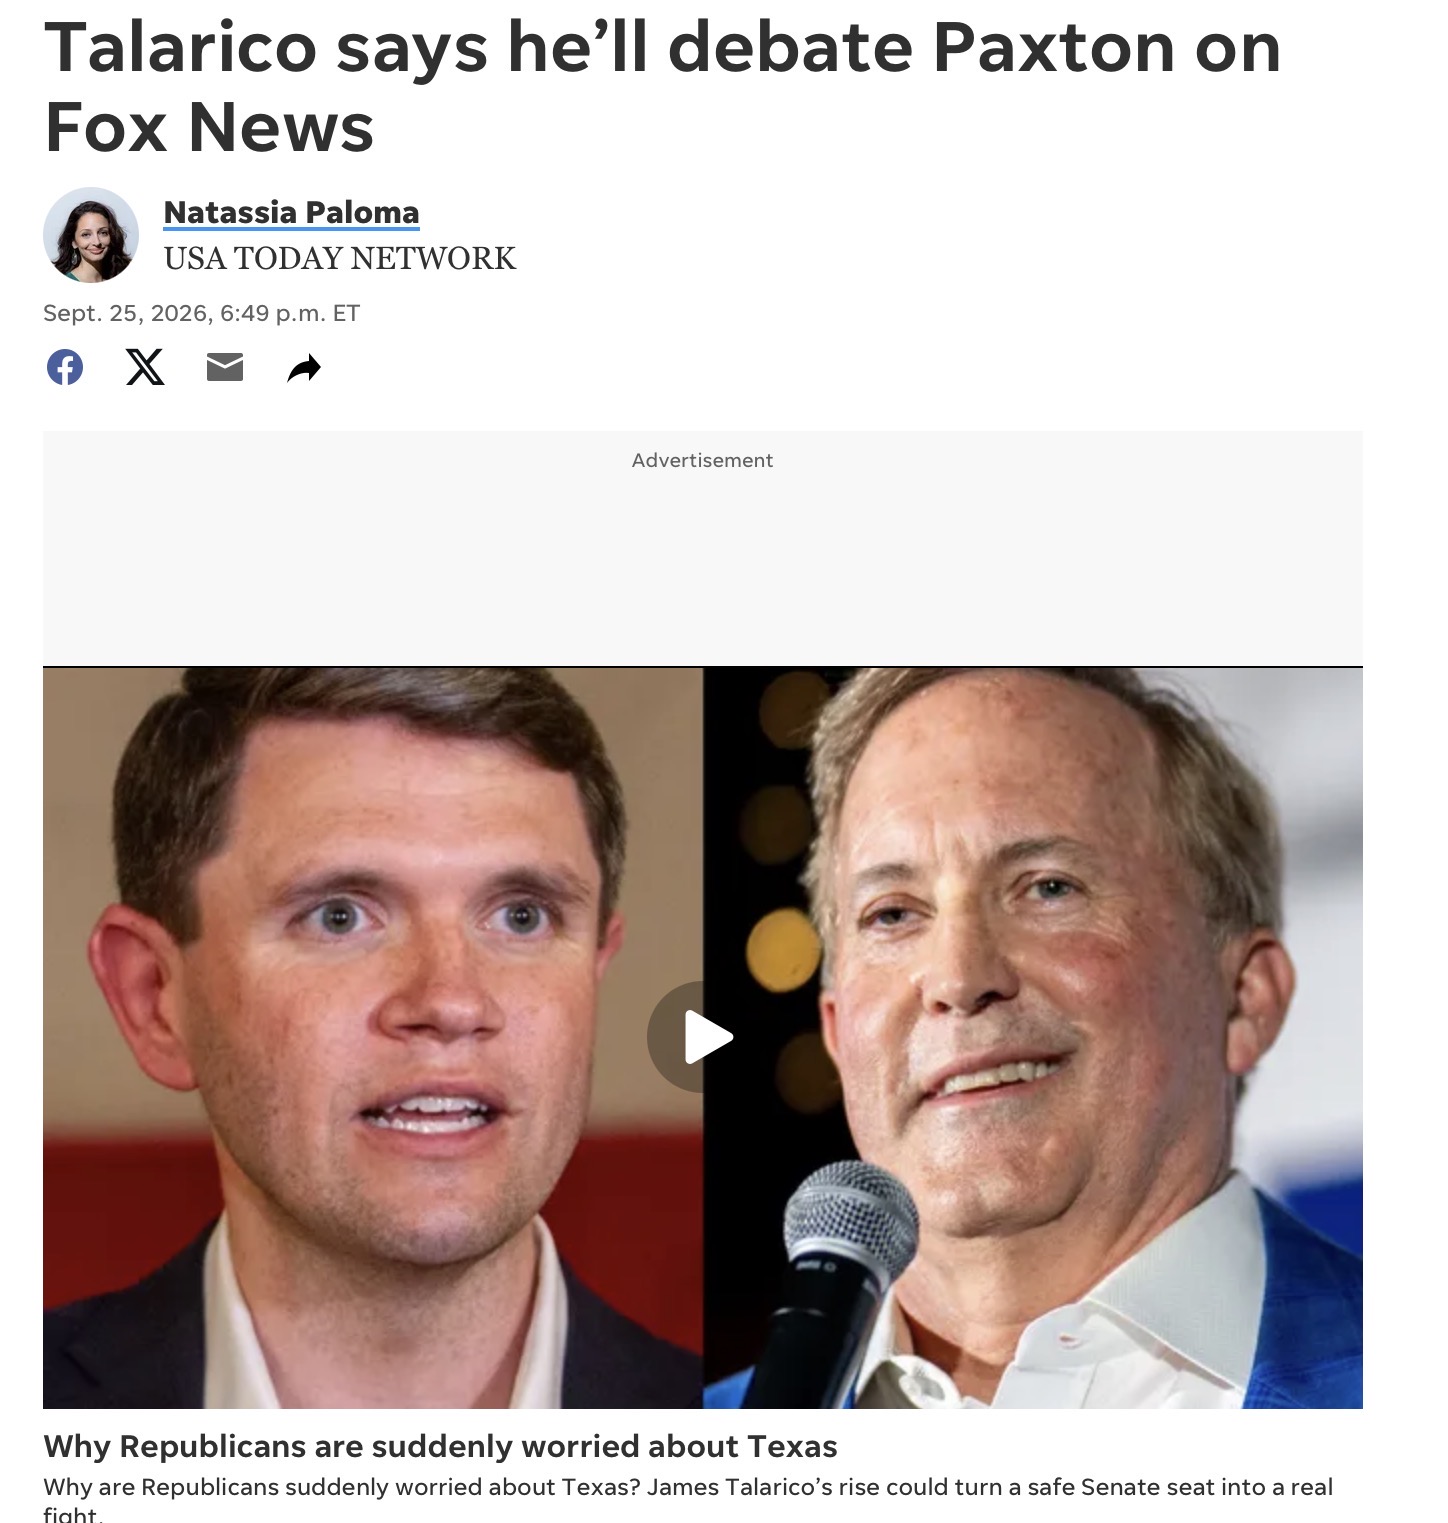
If Talarico were up by 5 (or 6) points, he wouldn’t dare ask for a debate. He would be benefitting from a once-in-a-generation electoral fluke and would let sleeping dogs lie.
If he were up by 1 or 2 points, debating Paxton risks exposing his (Talarico’s) ludicrous left-wing positions (anti-Christian, anti-oil, anti-gun, anti-meat, etc.) and forcing Texas Republicans to set aside the Cornyn-Paxton animosity and vote the party line.
You only demand debates in a race like this if your math looks exactly like mine. Flipping a Trump +14 state that just underwent a major Latino realignment is a much taller task than O’Rourke trying to flip a Trump +9 state with suburban slippage.
CONCLUSION
Every football team that steps onto a field has a chance to win. Sometimes that chance goes away after the first drive. Talarico’s pathway requires him to blow past O’Rourke’s margins in the key counties, benefit from 2014 (or worse) turnout in the red counties, and revert the Latino vote back to 2016-18 levels.
The demand for debates is the absolute tell that Talarico himself doesn’t believe the polling.
If Texas Republicans vote, Ken Paxton will be the next Senator from Texas.
Seth Keshel, MBA is a Senior Fellow at the Gold Institute for International Strategy and a retired Army Captain. He publishes Captain K’s Corner on Substack.