A simple lesson to cure your summertime polling panic
Class is in session. Grab a pen and paper and have a seat. This won’t take long, but will help you effectively punch holes in the entirely fraudulent operation known as election polling. I am becoming convinced that people who get polls right (within their own margin of error) peg results based on what everyone with a brain can figure out.
For instance, in the last five presidential elections held in Texas, the Democrat nominee has received a minimum of 41.38% (Obama 2012) and a maximum of 46.48% (Biden). Obama’s low point was marked out on the wrong side of a Romney blowout, and Biden’s high mark (in losing the state by 5.6%, the closest margin in a presidential race since 1996) was not easily repeatable in a post-2020 environment and without massive Hispanic support.
Republicans had between 52.06% (Trump 2020) and 57.17% (Romney) in that same timeframe, with Trump’s low share coinciding with Biden’s fluke (and inflated) percentage described above.
It’s hard to go wrong with calling it Republican 53, and Democrat 44 as a baseline. Run three points shy or too high, you’re still in the margin of error with a result between 6 and 12 points. Trump would have overrun it in 2024, but at least you didn’t look like an idiot putting out polls like we see today.
Case in point:
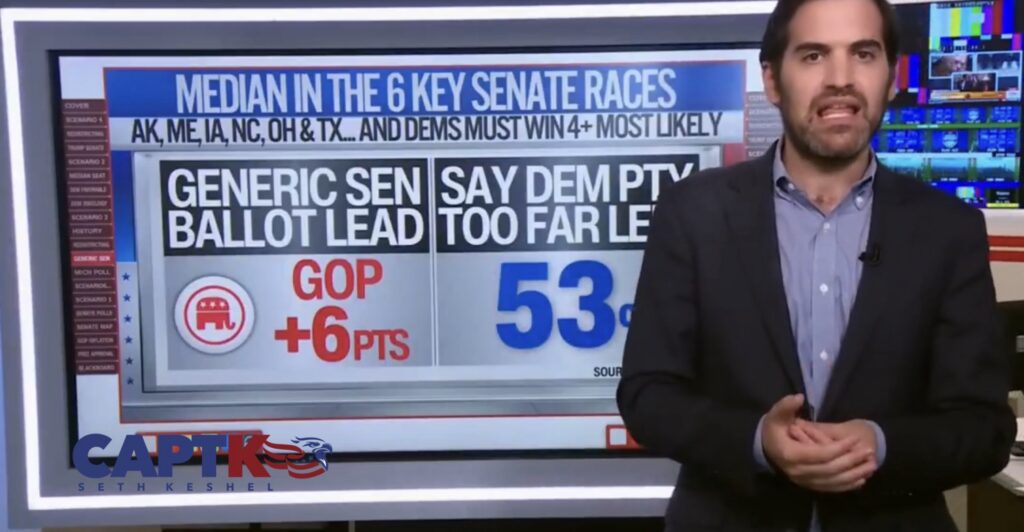
“CNN: Republicans are leading in the Senate generic ballot in the swing states. Sen Generic Ballot (swing states): R+6” — OSZ (@OpenSourceZone), August 19, 2026
CNN’s Harry Enten did a segment Wednesday pointing out that Republicans hold a 6-point lead in the generic Senate ballot in 6 key races:
Alaska – Sullivan (R-inc.) vs. Peltola (D)
Iowa – Hinson (R) vs. Turek (D)
Maine – Collins (R-inc.) vs. Jackson (D)
North Carolina – Whatley (R) vs. Cooper (D)
Ohio – Husted (R-inc.) vs. Brown (D)
Texas – Paxton (R) vs. Talarico (D)
Most people are taking wild swings at the House generic ballot, and the average of polls currently sits at D+6.4%. What that means is that this average suggests the electorate will be 6.4% more Democrat by affiliation (or perceived affiliation) than Republican in House races. This may not be correct come election time, but most people who study these maps and races realize Republicans have a puncher’s chance at holding the House against the grain of 92 years’ worth of midterm data suggesting failure for the president’s party.
If Republicans have reason for optimism in the House with a 6.4% generic ballot polling disadvantage, then what does it say to have a R+6.0% Senate ballot? First and foremost, it suggests all House polls are fraudulent and shouldn’t be considered as more reputable than a Magic 8 Ball from Spencer’s, or tarot cards on Bourbon Street. Second, it would suggest to me that Republicans would win all 6 of those Senate seats in question, take Michigan, and even be in the game in Georgia and New Hampshire (and possibly Minnesota).
But…the math.
If I have these numbers (1, 5, 7, 10), can they average 15? Of course not. They add up to 23, and divided by 4, you get an average of 5.75, helped substantially by the 10. In order for me to reach an average of a given number, at least one of the numbers in the set must surpass the stated average. So, riddle me this:
How in the hell does the GOP have a generic ballot in the Senate of R+6.0 when these are the current polling averages?
Alaska – Peltola (D) +2.0%
Iowa – Hinson (R) +0.7%
Maine – Jackson (D) +2.3%
North Carolina – Cooper (D) +8.0%
Ohio – Brown (D) +0.6%
Texas – Talarico (D) +1.2%
Let’s look at this mess with a little color commentary.
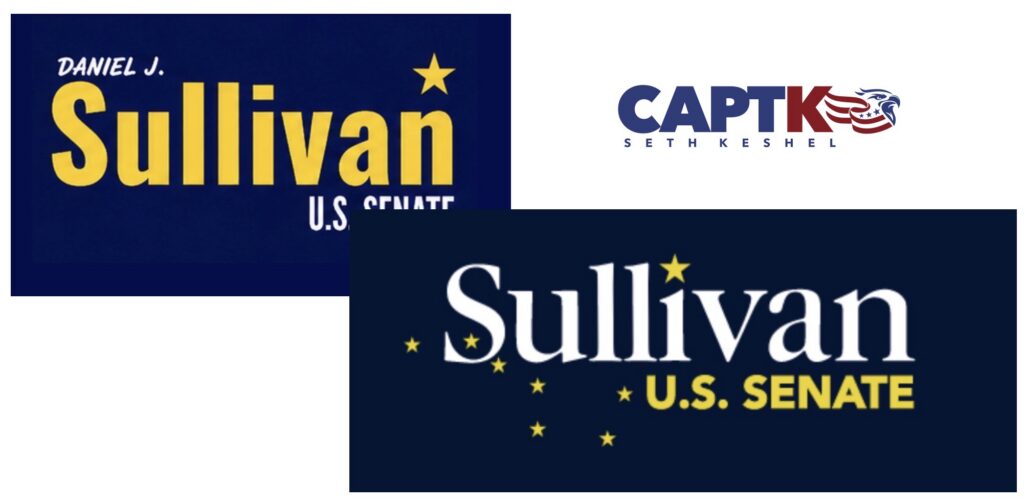
Peltola is hoping for the fake Dan Sullivan to get her over the top in the garbage Ranked Choice Voting system Alaska runs, but just fired her entire campaign staff.
Hinson is the only Republican leading in the average of polls, and only barely after a Turek +4 poll dropped from the brain trust over at FOX News.
Pollsters didn’t learn a damn thing after this masterpiece in 2020, the last time Susan Collins won reelection:
I’ll concede that most people have Roy Cooper favored in North Carolina, but 8 points is a ludicrous margin.
In Ohio, it was Husted, Husted, Husted, until FOX News’s team visited the Minneapolis learing center and deposited a Brown +8 to blow up the average of polls.
Ken Paxton’s race is likely to follow this pattern shortly:
“For all you Texas poll panickers – The first two months of Trump-Harris polled showed 10 polls with an average lead of Trump +6. Trump won by +13.7%, meaning the average of polls until the last two weeks was nearly 8 points off. They didn’t start to reflect reality until the…” — Seth Keshel (@RealSKeshel), August 11, 2026
So what is Enten doing over at CNN? My best guess is hedging, so when Republicans hold the Senate someone can go back in time and say, “Look, individual race polling is hard but our aggregate showed the Republicans had some serious momentum in the Senate!”
But seriously, what the hell? If we think Whatley is losing, and make a baseline assumption that Sullivan, Collins, and Husted may be in close races, which race bumped this average all the way to 6 points? I can see Hinson winning in the mid-to-high single digits, but that’s right at the average of 6. Would Paxton be winning by 12? Let’s play it out:
Let’s give Whatley -4, Sullivan, Collins, and Husted all +2, Hinson +6, and Paxton +12 (too high). That would give us 20 divided by 6, an average of 3.33%. CNN is saying 6 points, and none of this would really matter anyway since Texas is almost worth as many electoral votes as all of these other states combined, dwarfing them in voting population.
In order for the GOP to be leading by 6 points in these races speaking only in terms of nominal values (not factoring the weight of Texas or Ohio), you’d need to see numbers like this:
Whatley +2, Sullivan +8, Collins +4, Husted +5, Hinson +7, Paxton +10 – again, if we are just averaging their polling leads and not taking into consideration the disparities in popular votes to be cast.
Those leads would total 36, divided by 6 = 6 points.
The Moral of the Story
Don’t pee down my back and tell me it’s raining. Someone straddling the mainstream media and the phony polling apparatus needs to figure out how to present basic mathematical points to the people they are trying to deceive, because some of us have made quite a niche for ourselves exposing these lies.
If you want to read a lot more case studies of this sort, grab a copy of my best-selling book, The American War on Election Corruption. You’ll never see this world of lies the same way again.
Seth Keshel, MBA is a Senior Fellow at the Gold Institute for International Strategy and a retired Army Captain. He publishes Captain K’s Corner on Substack.